
Recycling looks different in every sector.
What works for a retailer won’t look the same for a restaurant, an office building or a public sector organisation. Different waste streams, different pressures and different opportunities all play a role. That’s why looking at recycling standards by industry matters.
As part of our 2025 Recycling Standards campaign, we’ve taken a closer look at how businesses are performing across key sectors. The aim is simple: to give clearer context around what ‘good’ looks like, and how recycling performance compares across industries.
What Recycling Standards accreditation shows
Recycling Standards accreditation gives a clear picture of how well recycling systems are working in practice.
It’s based on real collection data and focuses on consistency, accuracy and environmental impact rather than box ticking.
Gold & Silver Accredited businesses tend to:
- Separate waste correctly
- Use a broader mix of recycling services
- Reduce contamination
- Track performance over time
- Improve results year on year
Reviewing benchmarks by sector helps put individual performance into context and highlights where the biggest opportunities sit.
Retail recycling standards
Retail businesses typically handle high volumes of packaging and fast-moving stock. Recycling systems need to be simple, visible and easy for teams to follow during busy trading hours.
The figures below reflect current retail recycling standards based on Recycling Standards data.
Sector benchmarks
- Average recycling rate: 51%
- Average tonnes diverted from landfill: 8
- Average trees saved: 42
- Average CO₂e avoided: 8.7 tonnes
- Average number of services used: 2
Most retailers focus on core streams such as cardboard and dry mixed recycling. Businesses that go further by adding specialist services often see higher recycling rates and less waste going to landfill overall.
Retail-specific services can make a real difference, especially in customer-facing spaces. These include:
- Textile recycling for damaged, returned or unsellable clothing
- Coat hanger recycling, helping capture a high-volume plastic stream that’s often missed
- Return & Recycle Points, giving customers an easy way to return items like packaging or worn products in store
When these services are clearly signposted and built into day-to-day operations, they’re easy for teams to manage and simple for customers to use. The result is better-quality recycling, lower contamination and a more visible commitment to sustainability on the shop floor.
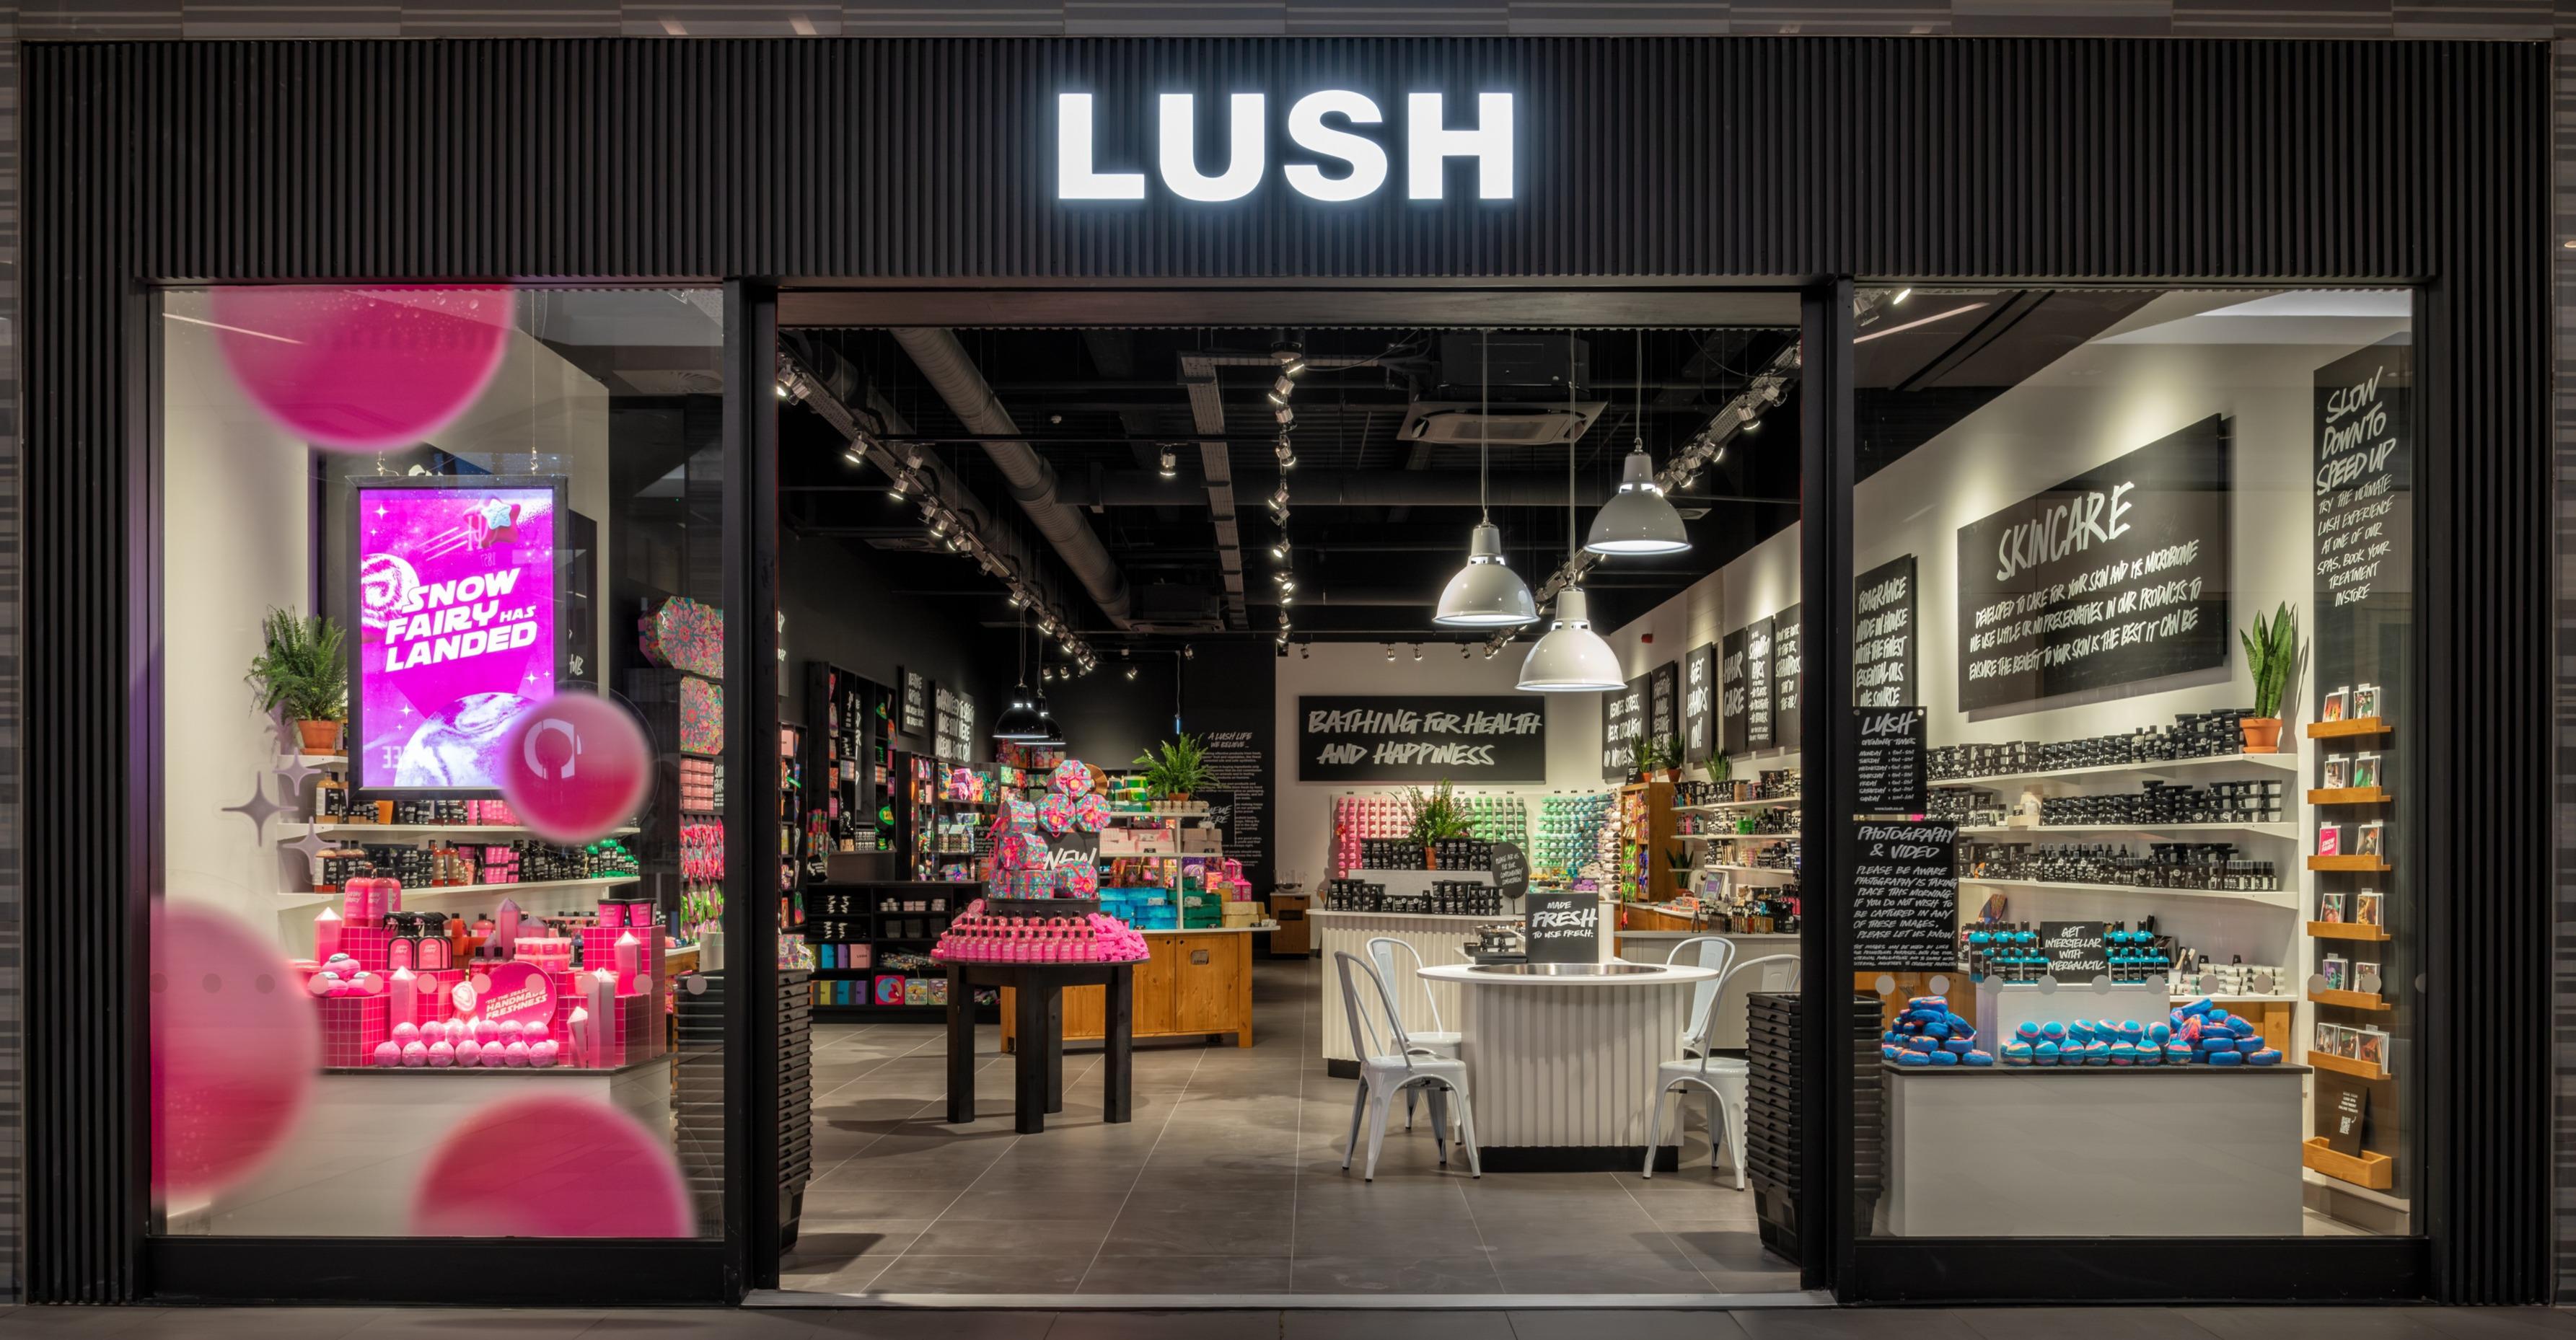
Top performers
- Uniqlo
- LUSH
- Oliver Bonas
These brands show how consistent systems and clear processes can deliver strong results across multiple sites.
Hospitality and F&B recycling standards
Hospitality and food businesses generate a wide mix of waste, from food scraps and coffee grounds to glass and packaging. That makes recycling more complex, but also more impactful when done well.
This data reflects hospitality and F&B recycling standards across the First Mile network.
Sector benchmarks
- Average recycling rate: 48%
- Average tonnes diverted from landfill: 33
- Average trees saved: 108
- Average CO₂e avoided: 17 tonnes
- Average number of services used: 3
Coffee waste plays a big role in this sector. Businesses that separate these streams properly tend to reduce landfill waste significantly while improving overall recycling quality.
Clear front-of-house (FOH) signage and staff education are just as important as back-of-house systems. When customers know where to put cups, food waste and packaging, contamination drops and recycling rates improve.
Simple, well-designed signage helps guide behaviour at busy moments, while regular staff training ensures bins are used correctly throughout the day. Together, these small changes make recycling easier for everyone and help hospitality businesses get more value from the services they use.
Top performers
- Rare Restaurants
- Royal Ballet and Opera
- Curzon Cinemas
These organisations use a broader mix of recycling services, helping capture materials that are often missed in hospitality settings.
Commercial real estate recycling standards
Office buildings and commercial properties serve multiple occupiers, each with different recycling habits. Success depends on consistency, clear signage, and the right services in place.
The figures below reflect commercial real estate recycling standards.
Sector benchmarks
- Average recycling rate: 59%
- Average tonnes diverted from landfill: 10
- Average trees saved: 34
- Average CO₂e avoided: 6 tonnes
- Average number of services used: 3
Buildings that offer specialist services such as WEEE, batteries, and textiles often perform better overall. These streams help reduce contamination and stop recyclable materials ending up as general waste.
For multi-occupancy buildings, RecycleID waste tracking plays an important role in improving performance. This tool help building managers:
- Track waste and recycling by individual occupier
- Monitor contamination levels across the building
- Identify where extra support, signage or services are needed
- Share clear, transparent data with tenants
This level of insight makes it easier to manage complex sites, support occupiers more effectively and drive consistent improvement across the whole building.
Top performer
- 40 Leadenhall
Strong performance often comes from good collaboration between building management and occupiers, supported by clear systems and reporting.

Public sector recycling standards
Public sector organisations manage a wide range of spaces, from offices to public-facing buildings. Recycling systems need to work for staff, visitors, and contractors alike.
This reflects current public sector recycling standards based on available data:
Sector benchmarks
- Recycling rates vary by building type
- General waste reduction improves with clearer separation
- Trees saved and CO₂e avoided increase with service variety
- Average number of services used tends to be higher than average
Public sector organisations that use more tailored recycling services often see better engagement and stronger long term results.
What the data shows across sectors
When you look across all sectors, a few patterns stand out.
- Businesses using more recycling services usually recycle more
- Food waste and coffee recycling have a big impact in hospitality
- Specialist streams improve results in offices and retail
- Clear systems lead to better engagement and lower contamination
Strong recycling performance comes down to using the right services for each sector and making them easy to use every day.
See how your business compares
If you’re already part of the Recycling Standards campaign, your recycling data’s available through the First Mile portal. It shows how your business is performing and where there may be opportunities to improve.
Comparing results against sector benchmarks can help identify missing services or simple changes that could make a meaningful difference.
If you’re a current First Mile customer that wants to see how your business stacks up or explore new recycling options for your sector, understanding your current performance is a good place to start. If you’re not a First Mile customer but curious about how we might be able to help you level up your recycling game, you can make an enquiry here and our helpful team will be in touch to find you a waste solution that works for your business.

